Reg D 506(c) · Verified accredited investors only

Monthly income,secured by real estate.

Invest into a portfolio of senior secured real estate loans.

Latest funded deals
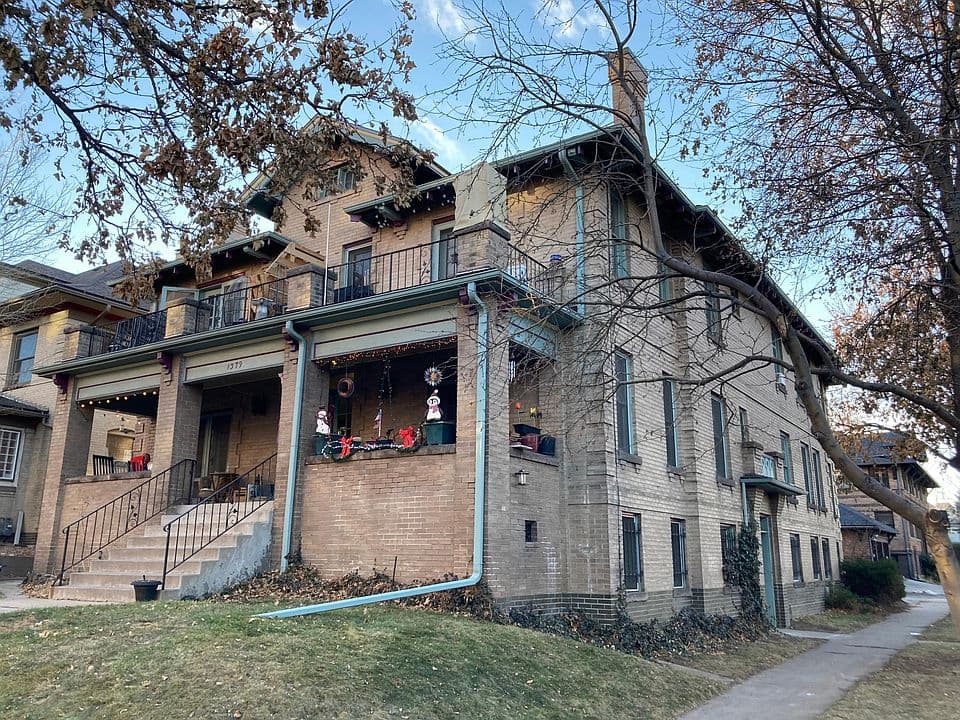
Recently funded real estate loan in Brentwood, NYRefinance

Brentwood, NY

Loan amount$536,250
Funded Jul 29, 2026
13.0%Latest Class A-1 annualized distribution — Q2 2026
52Loans funded
$17.7MTotal origination
35Loans paid back in full
Lifetime track record. Current portfolio data as of Aug 4, 2026.

What is the right investment to replace a paycheck?

Between flipping homes, running apartment buildings, and developing ground-up projects, our founders kept coming back to lending: yield, consistency, & collateral.

How We Protect Capital

0%

Reviewed lifetime default rate

$0 principal lost across 52 loans originated.

Reviewed through Jul 29, 2026
40.9%

Manager Co-Invest

DeMok's capital is invested alongside LP capital.

59.7%

Portfolio LTARV

About 60¢ committed for every $1 of completed property value.

$17.7M

Lifetime Originations

52 loans funded; $9.8M of principal already paid off.

All three partners approve every loan before it funds.

View Our Performance

Review aggregate portfolio metrics immediately.View Live Performance
Portfolio Dashboard

Current aggregate portfolio

Portfolio snapshot

As of Aug 4, 2026
Currently Deployed$6.5M
Gross Book Yield16.1%
Portfolio LTARV59.7%
Manager Co-Invest40.9%

Diversified by state

Shows how active fund capital is spread across markets, weighted by each loan's current outstanding principal.

Portfolio diversification by state: NJ 53.0%, NY 16.1%, NH 15.5%, AL 10.1%, MA 3.4%, OH 1.2%, PA 0.7%

  • NJ53.0%
  • NY16.1%
  • NH15.5%
  • AL10.1%
  • MA3.4%
  • OH1.2%
  • PA0.7%

Diversified by property type

Shows how active fund capital is spread across property types, weighted by current outstanding principal.

Portfolio diversification by property type: Single-family 42.3%, 2–4 units 12.9%, 5+ unit commercial 12.3%, Land 32.6%

  • Single-family42.3%
  • 2–4 units12.9%
  • 5+ unit commercial12.3%
  • Land32.6%

We track the portfolio from every angle.

Qualified investors can review portfolio growth, concentration, risk bands, origination cadence, maturity schedules, payment structure, and valuation methodology.
Weekly portfolio trendBorrower exposureLTARV bandsBorrower credit scoresFunded originationsScheduled maturitiesPayment structureValuation methodology
Explore the Portfolio Dashboard

Who We Are

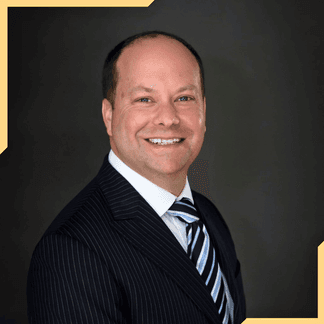
Portrait of TJ Burns, Partner at DeMok Capital

TJ Burns

Partner

Prior: Multifamily fund partner and private credit fund manager with $15M of investor capital managed. Former engineer at Amazon. Mechanical engineering degree from MIT.

Portrait of Anthony DeFilippis, Partner at DeMok Capital

Anthony DeFilippis

Partner

Prior: Traded derivatives at Goldman Sachs and structured debt at Patton Logistics. Master's in quantitative finance from Stevens Institute. Former active house flipper.

Portrait of Andrew Mokotoff, Partner at DeMok Capital

Andrew Mokotoff

Partner

Prior: Structured CLOs at Anchorage Capital, worked in technology at JPMorgan, and built AI systems at Amazon. Computer science degree from WPI. Several successful ground-up developments completed in Brooklyn, New York.
FAQ

DeMok Capital is intended for verified accredited investors. Because the offering is expected to rely on Rule 506(c), accredited status must be verified before subscription materials are reviewed or accepted.

The strategy focuses on senior-secured loans backed by real property. If a borrower stops performing, the collateral and recovery process stand behind the position, subject to the risks described in the offering documents.

The target cadence is monthly income from interest collected across the loan portfolio. Final distribution mechanics are governed by the fund documents and available cash.

The underlying loans are short-duration, but fund interests are illiquid and should not be treated like a bank account or brokerage sweep. Lock-up, redemption, and notice terms are controlled by the offering documents.

Minimums and share classes are detailed in the Fund Deck. After approval, eligibility, verification, and document review continue through Subscription & Documents.

The strategy focuses on senior-secured loans backed by residential investment real estate. Collateral, lien position, reserves, and recovery rights are reviewed at the loan level and governed by the fund documents.

Loans are intended to be short duration and tied to bridge, rehab, or other transitional real estate business plans. Actual duration varies by loan and portfolio composition and is reported in investor materials.

The public calculator is an illustrative 13% annualized scenario. Investors below $150K are modeled with a 7% preferred return, and investors at or above $150K are modeled with an 8% preferred return plus quarterly profit share. Returns are projections only and are not guaranteed.

Illustrative 13% annualized scenario

Calculate your projected income.

Enter your investment to see projected monthly preferred return, quarterly profit share, and total first-year income.

$50,000$1,000,000

Projected first-year income

$19,500

Effective return 13.0%Projected balance $169,500

Paid Monthly$1,000.008.0% preferred return
Paid Quarterly$1,875.00Profit share
Total Annual$19,500Total year-one income

Projected cumulative income

$0$5,000$10,000$15,000$20,000Mo 1Mo 3Mo 6Mo 9Mo 12

Important disclosures. The figures shown are modeled after a projected 13% annualized return. This is not guaranteed. These figures are for investor projection purposes only.

This calculator is provided for illustrative and informational purposes only and does not constitute an offer to sell, or a solicitation of an offer to buy, any security or investment product. Any offering is made solely to eligible, accredited investors pursuant to DeMok Capital's confidential offering documents, and those documents supersede anything shown here.

Projected returns are hypothetical and based on stated assumptions: a 7% preferred return for investments under $150,000, an 8% preferred return for investments of $150,000 or more, and an approximate 1.25% quarterly profit share. Preferred return and profit-share distributions depend on fund performance and available distributable cash and are not guaranteed. Reinvestment scenarios assume all distributions are reinvested and compounded, which may not reflect actual timing or amounts. Figures do not account for fees, expenses, taxes, or the timing of capital contributions and distributions. All investments involve risk, including possible loss of principal.

See exactly what your capital would be backing.

View Our Interactive Pitch Deck

This is a 506(c) offering open to accredited investors only.